Coverage
Coverage reports for Cypress and Playwright - collecting and sending the reports to Currents
Coverage reports collection is in beta mode. Only Cypress support is available at the moment. cypress-cloud
version 1.9.5+
is required.
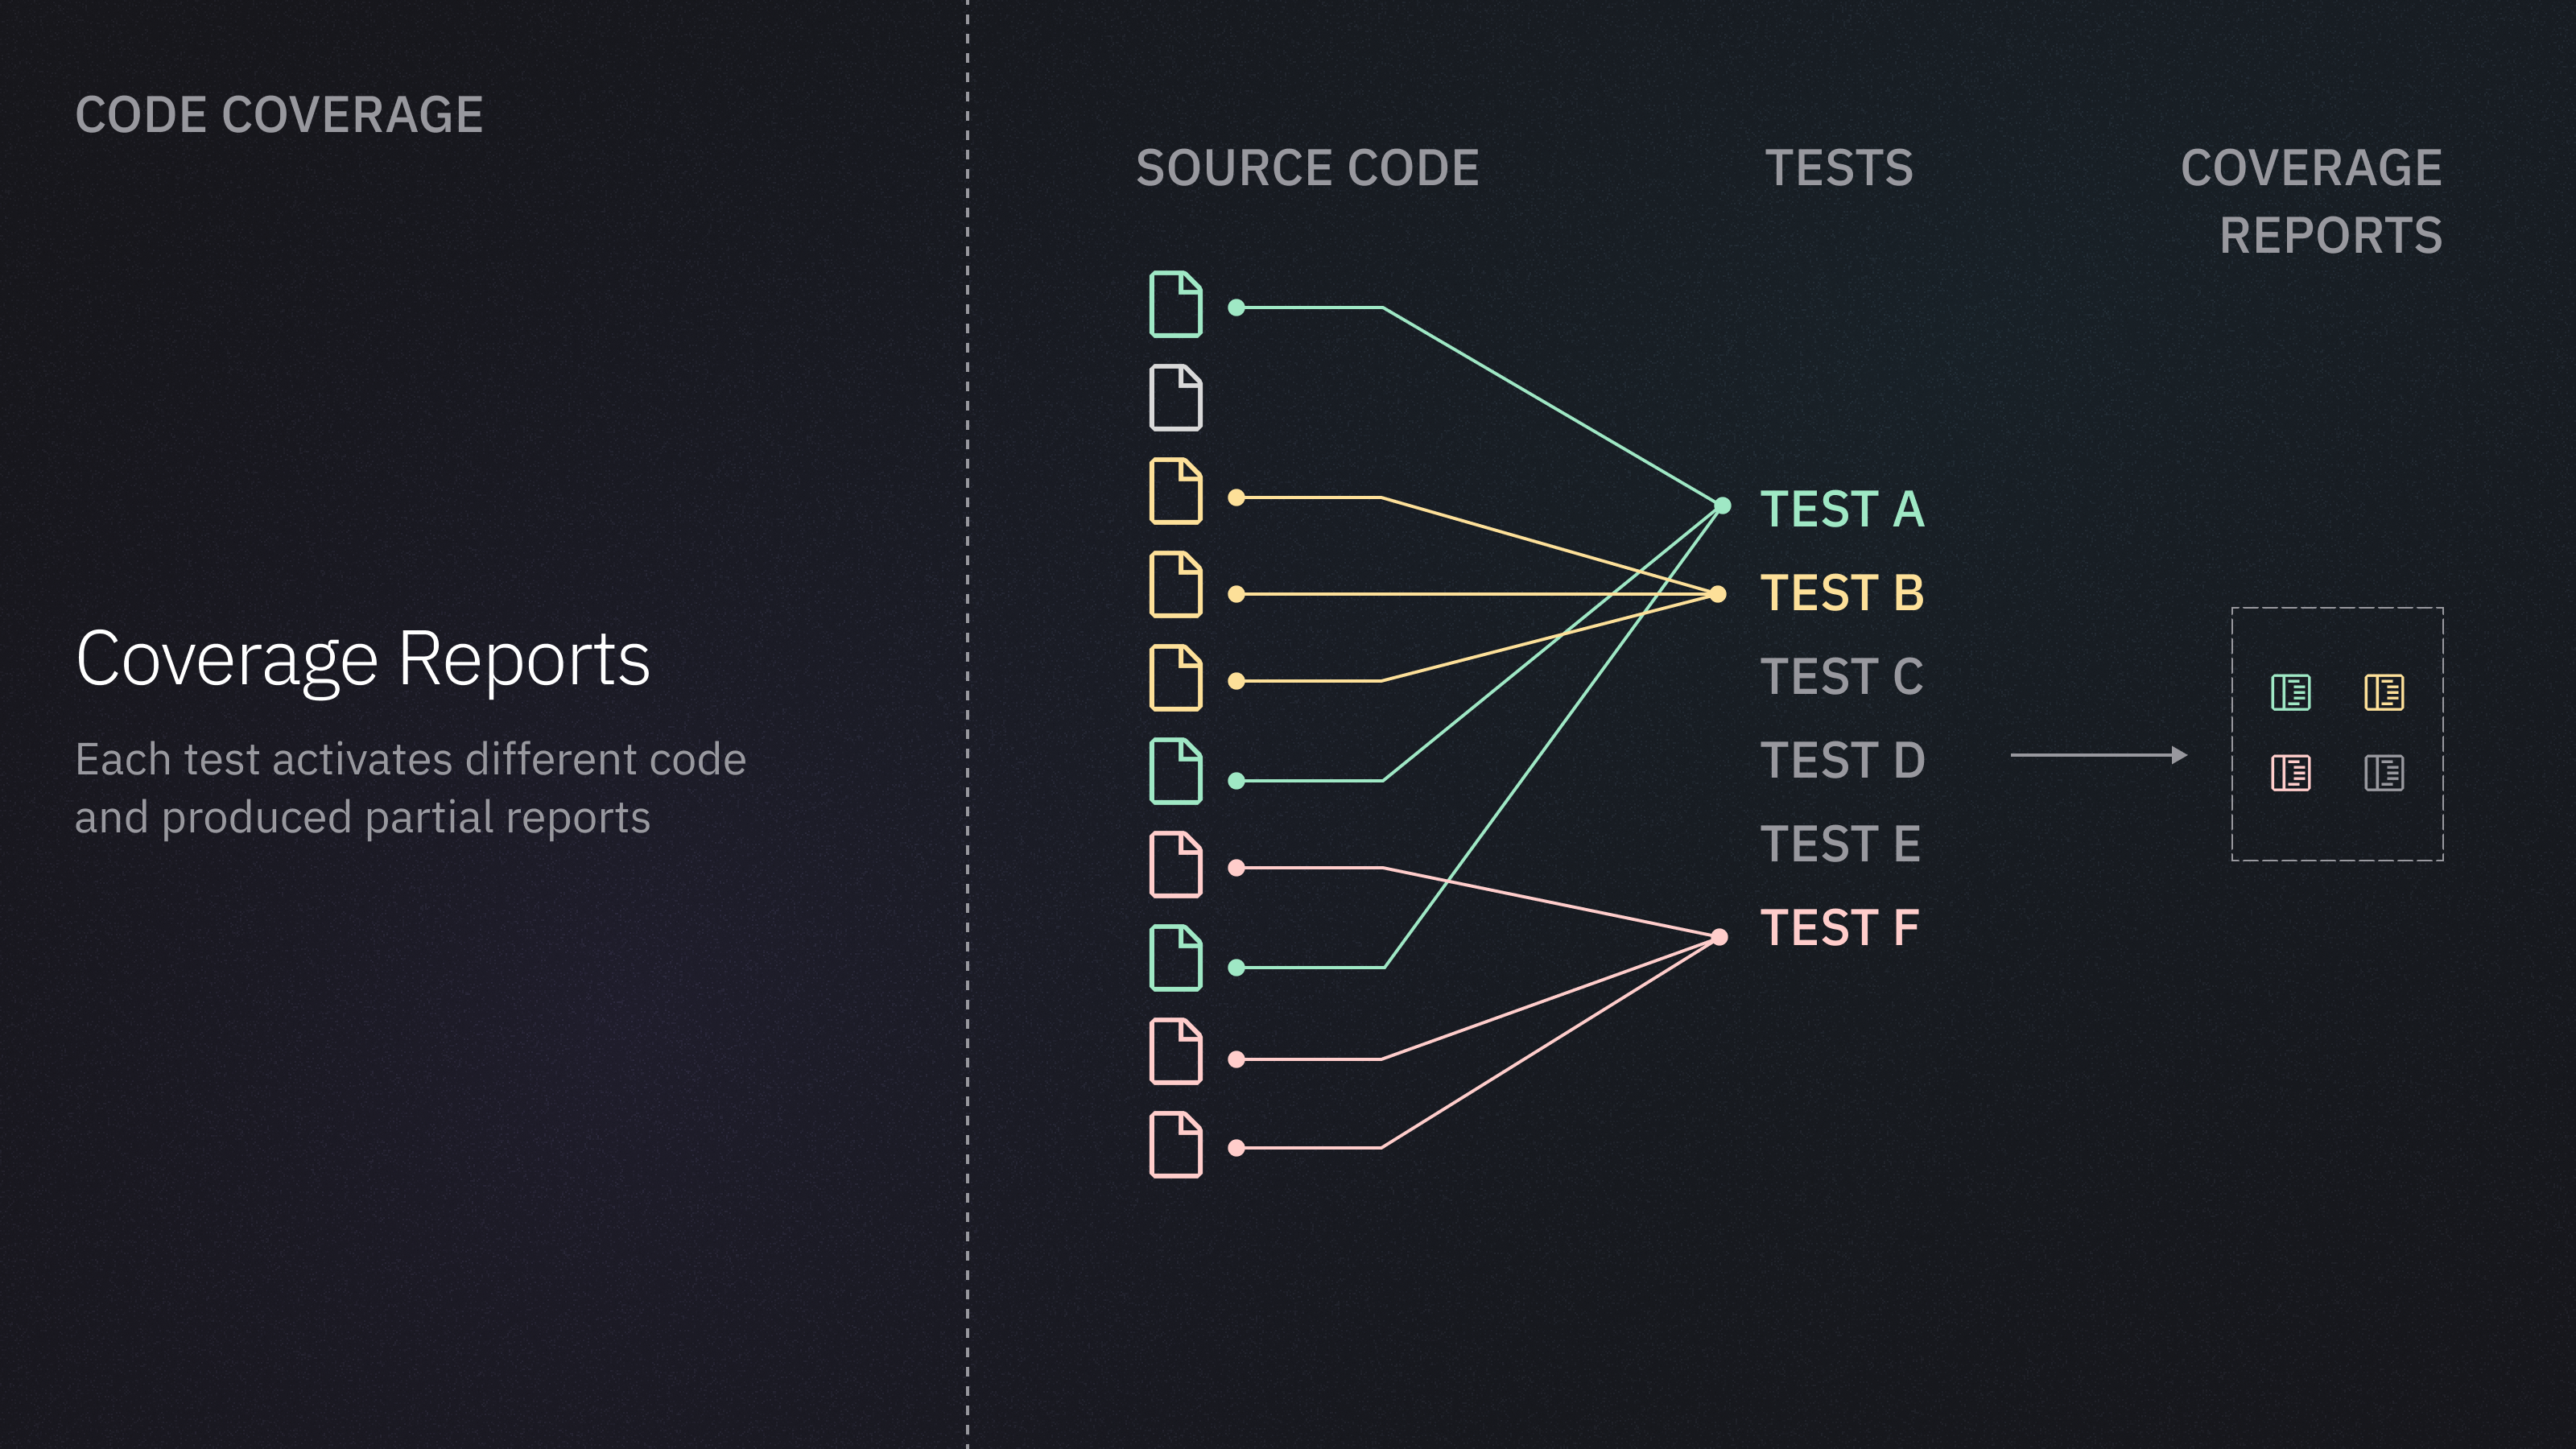
Code coverage provides information on whether and how frequently certain parts of code have been executed. It is commonly used to determine how thoroughly a test suite exercises a particular codebase.
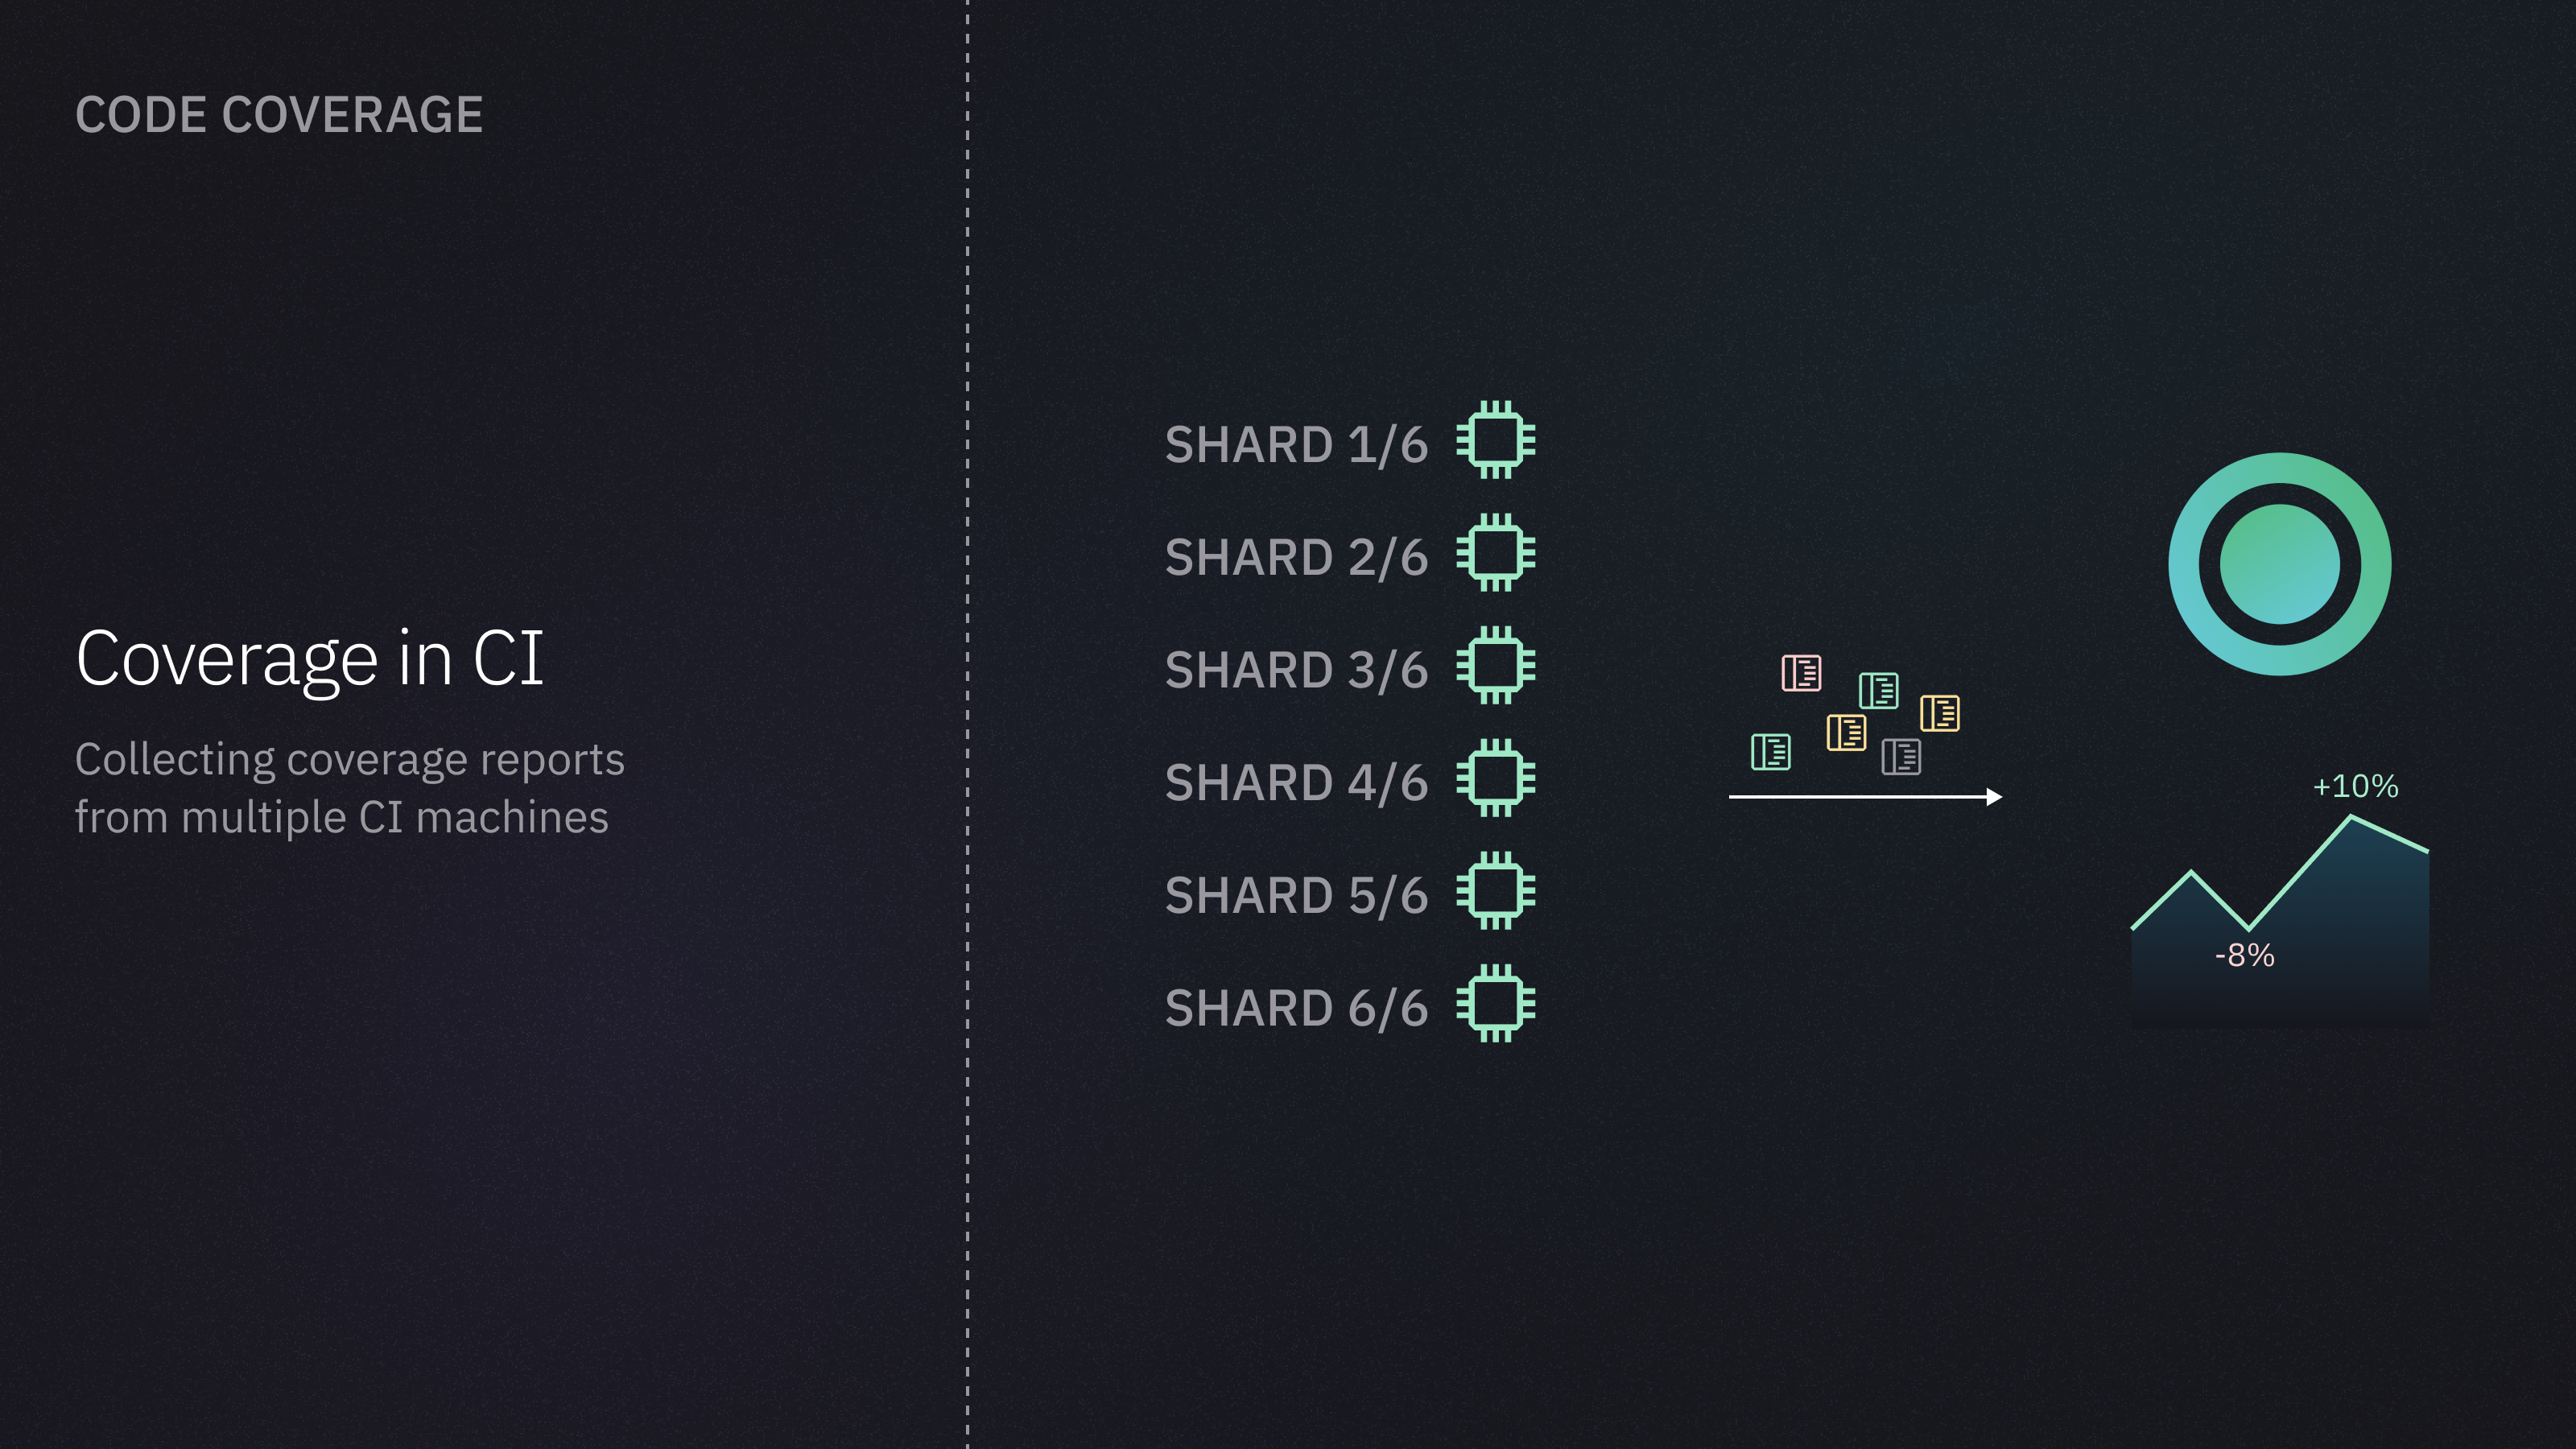
Playwright and Cypress both support collecting code coverage information from the underlying application. When running tests in a distributed and parallel CI environment, it's necessary to collect coverage data from multiple CI containers, merge the resulting reports, and store them in a central location.
By integrating Playwright or Cypress with Currents, you can easily collect, merge, and track code coverage metrics, along with other test-related metrics. This includes aggregating data across multiple executions and filtering by tags or git branches.
Code Coverage Overview
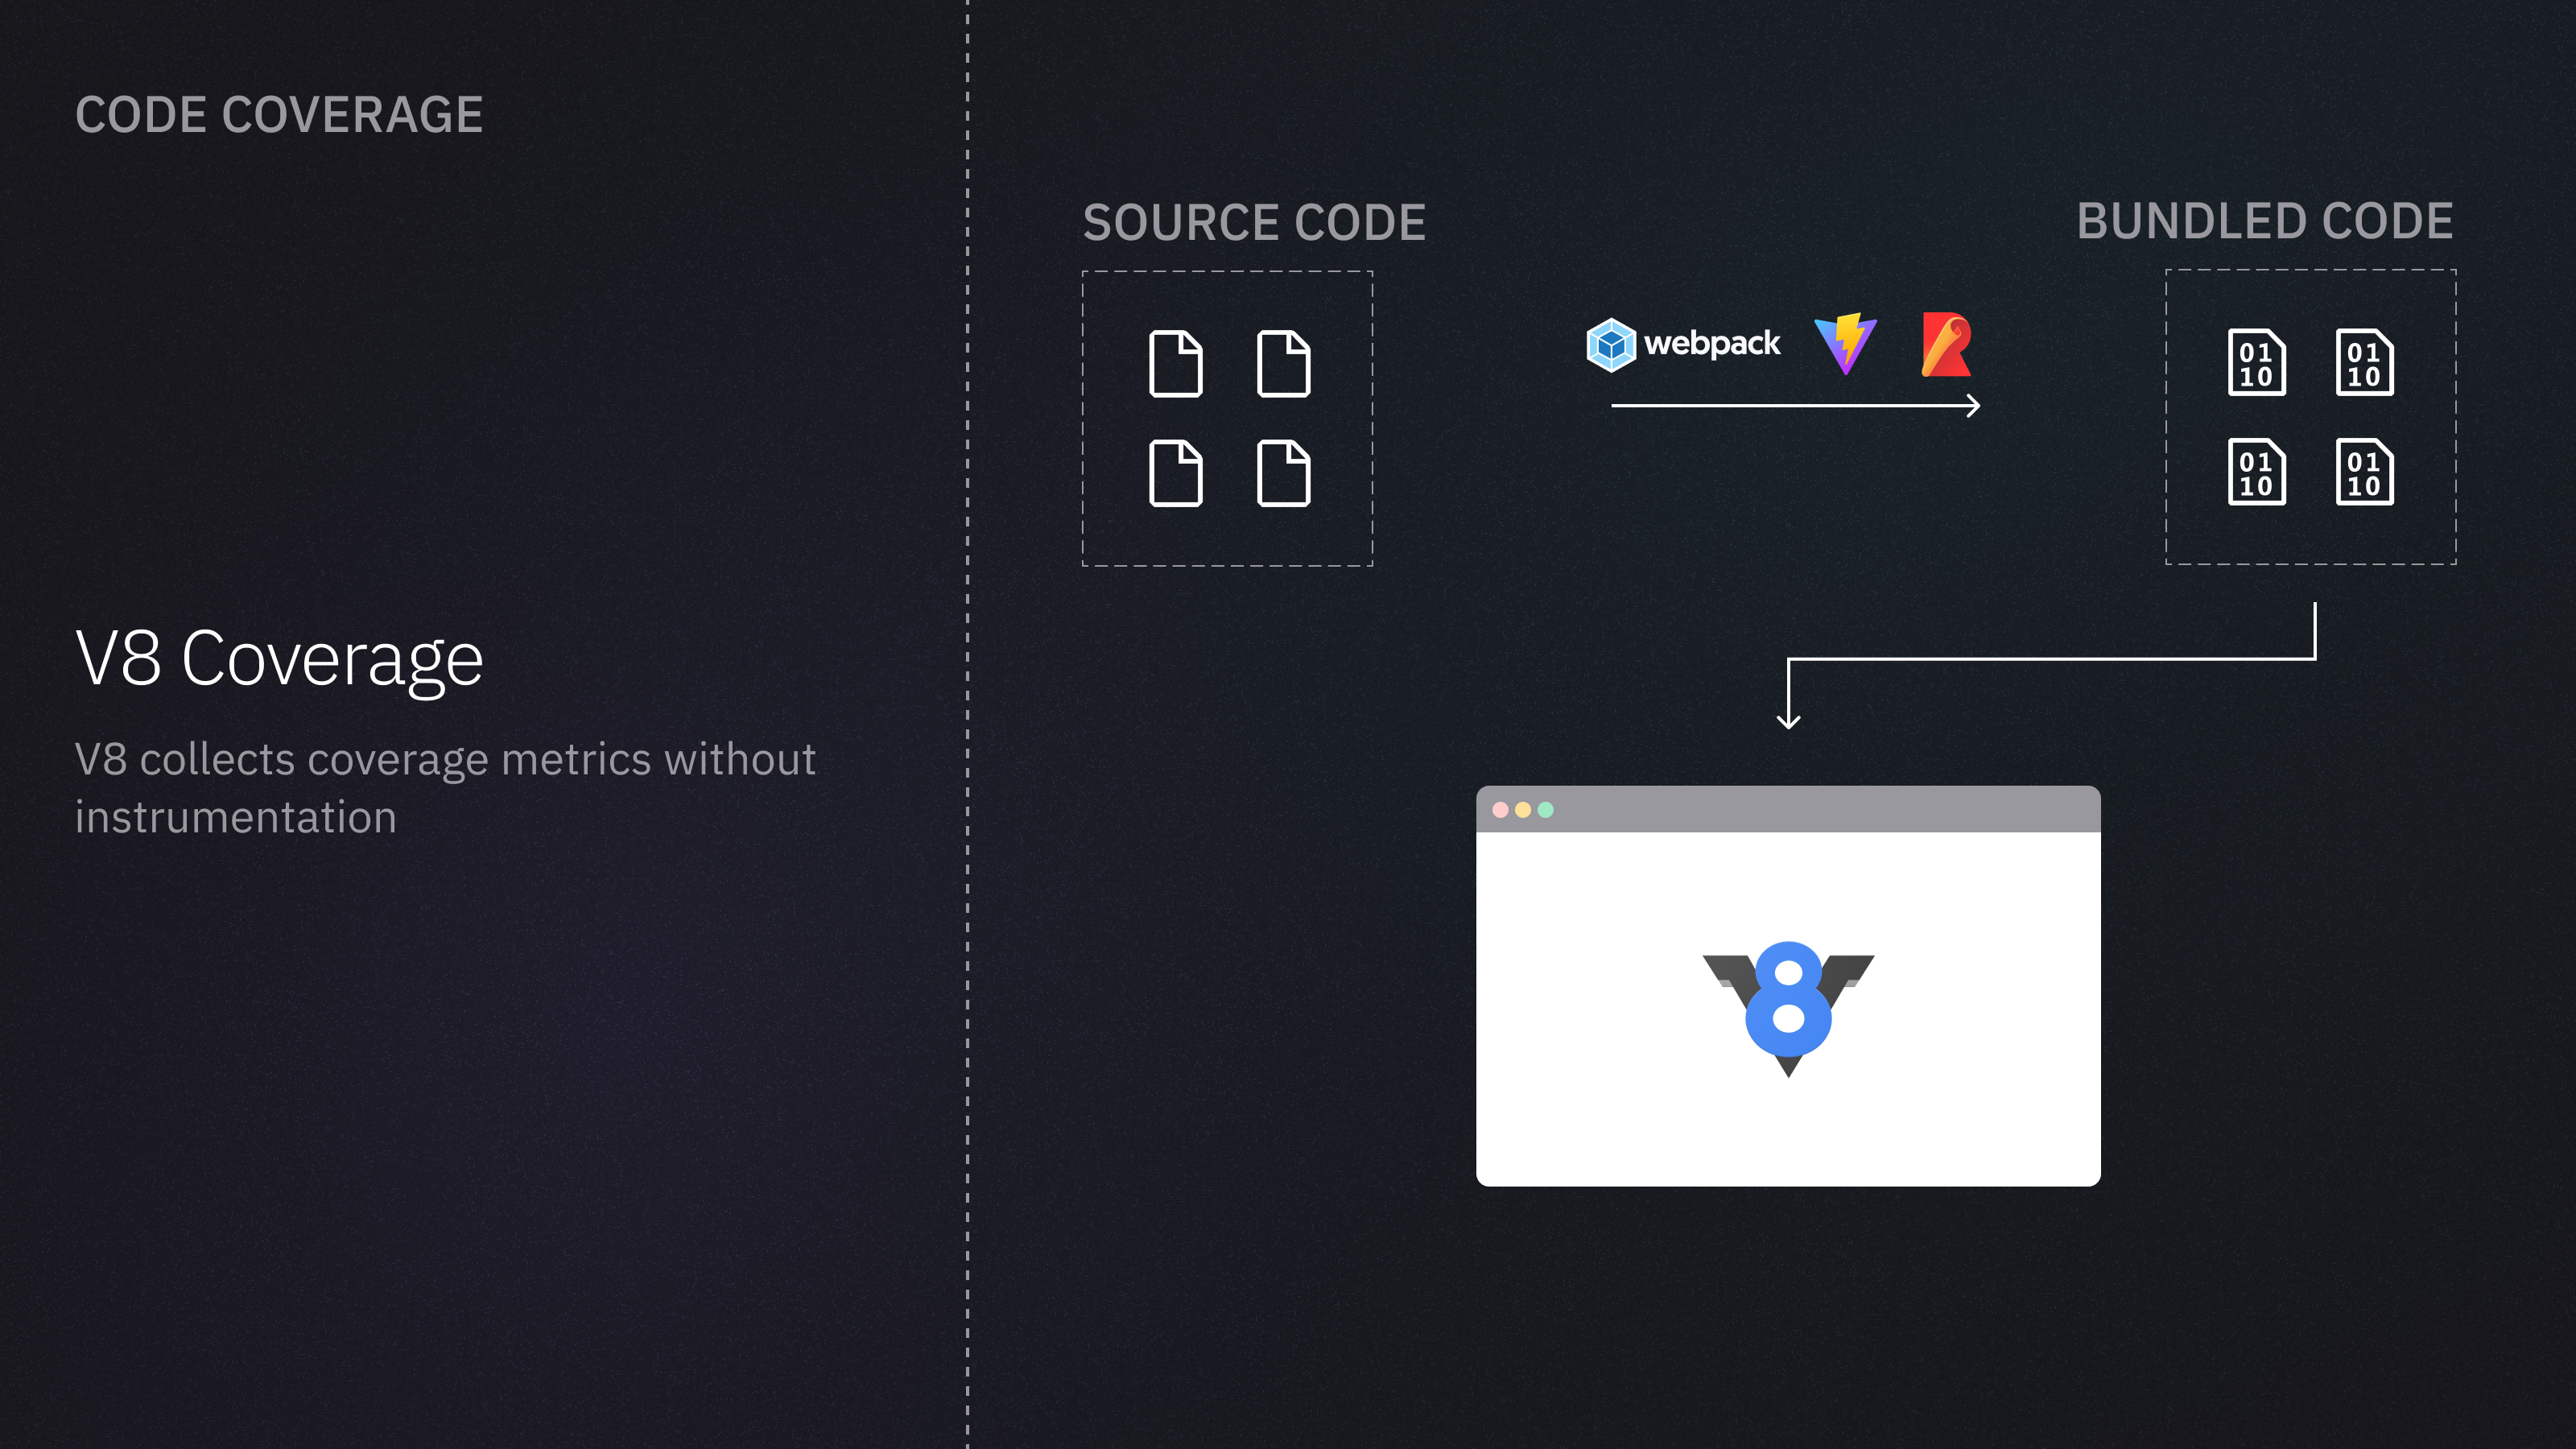
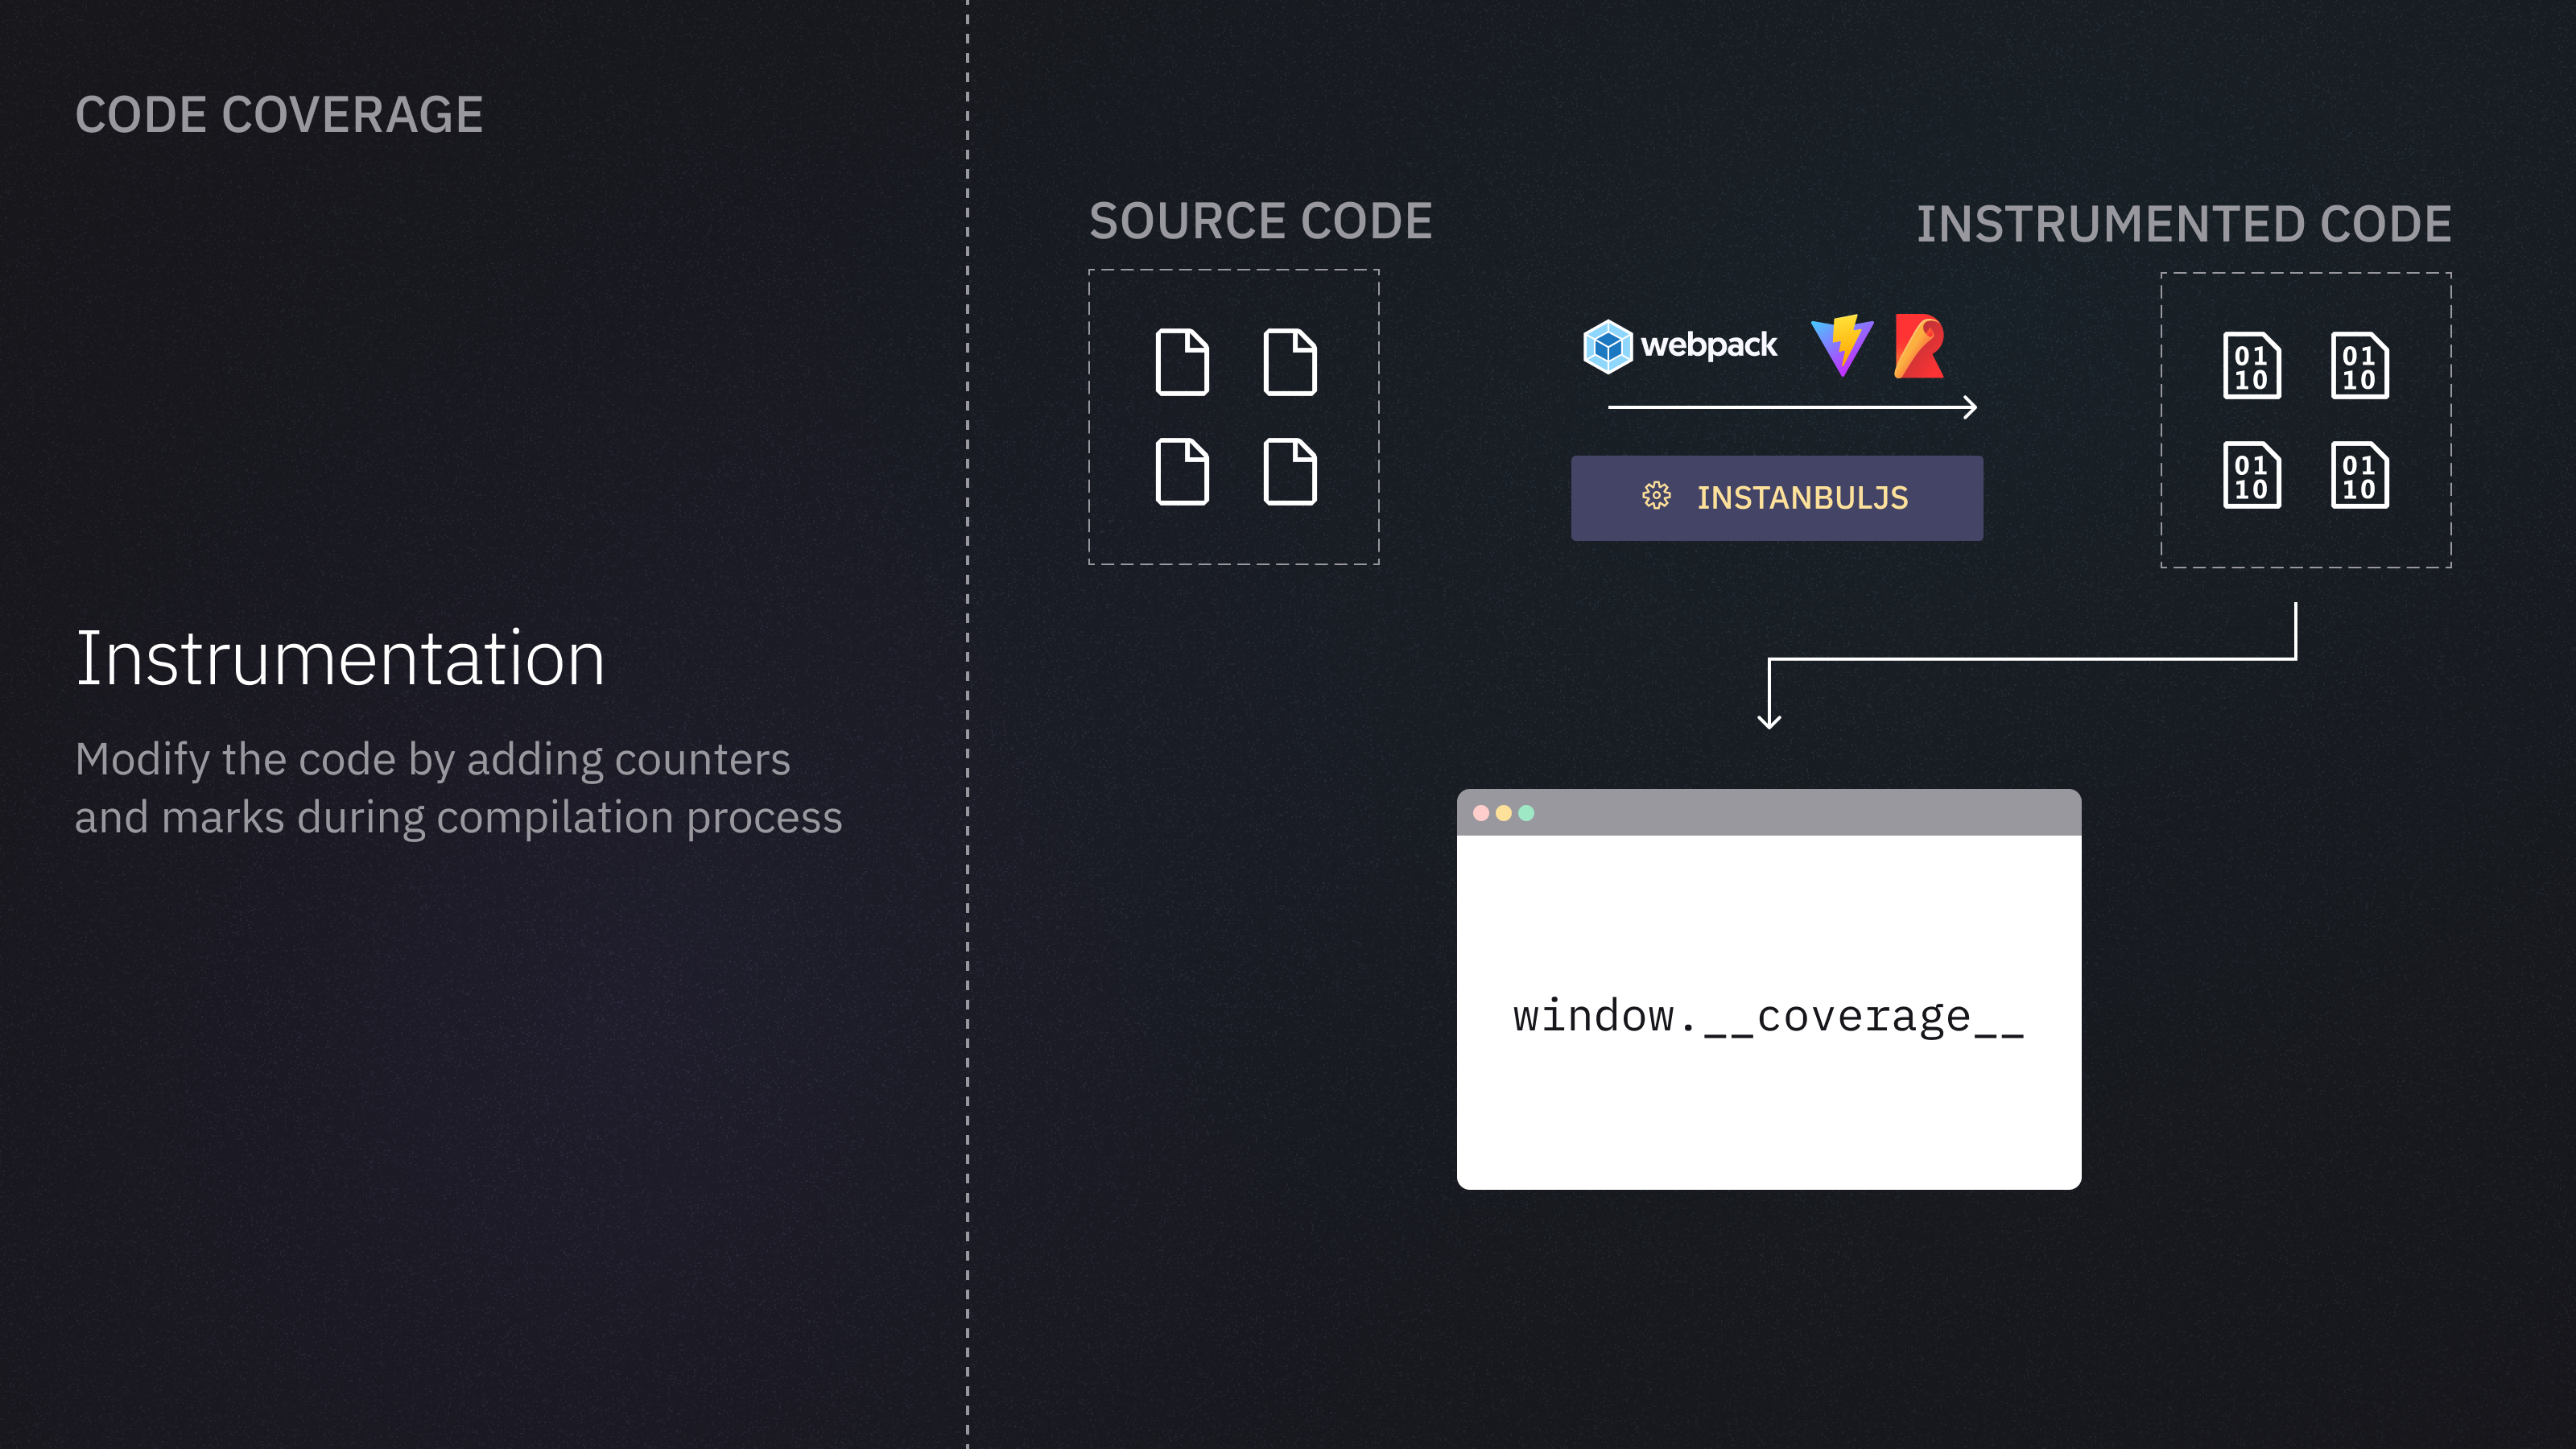
To collect code coverage information, you need to add extra functionality to the source code that allows tracking which parts of the code are being executed during a test run. This process is known as instrumenting the code. By instrumenting the code, you can automatically augment it with markers and counters that allow you to calculate what parts of the code (and how often) were accessed during a test run. The most popular tools used for code instrumentation are Istanbul (and recently v8 ).
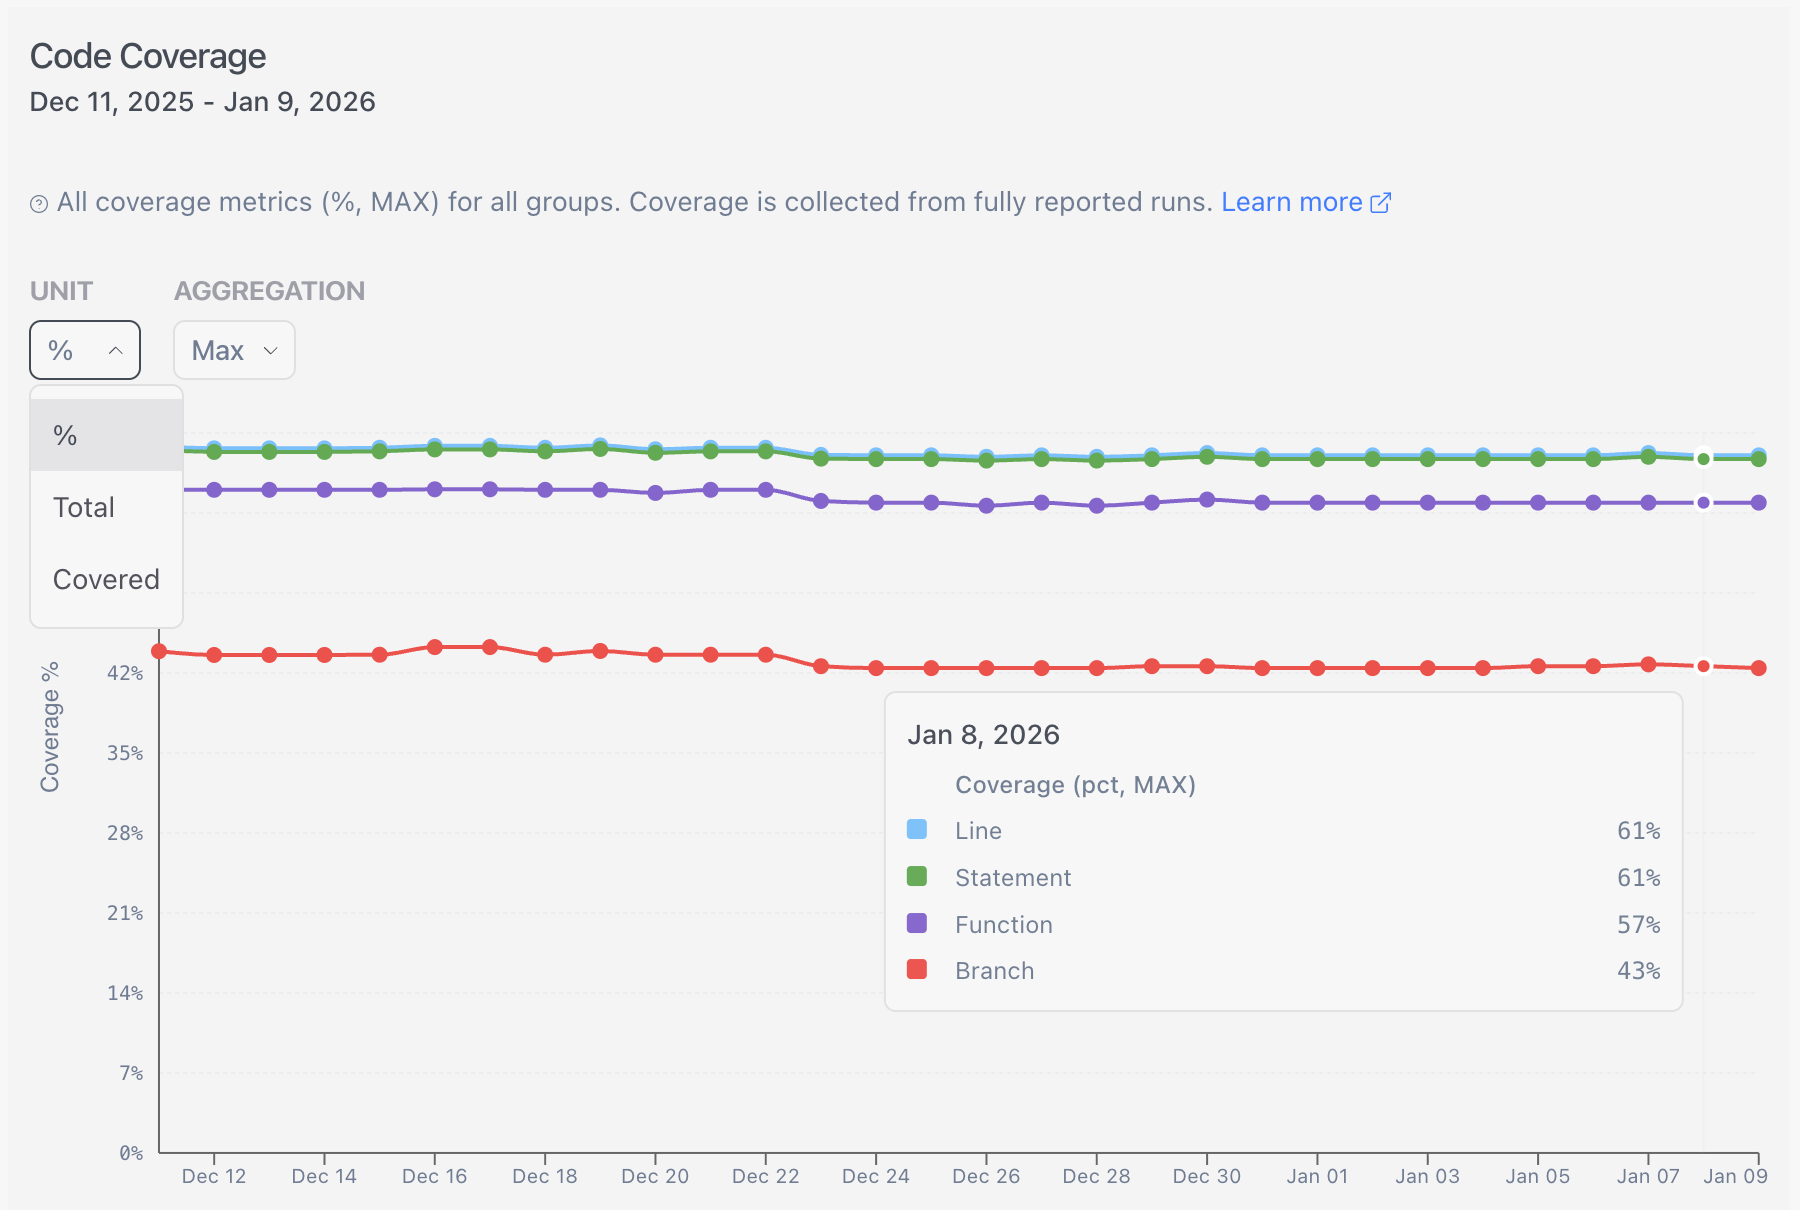
Traditionally, code coverage metrics include line coverage, branch coverage, function coverage, and statement coverage.
Line coverage measures the percentage of lines of code that have been called
Branch coverage measures the percentage of if/else code branches that have been checked
Function coverage measures the percentage of a program's functions that have been called
Statement coverage measures the percentage of a program's statements that have been called
Read more about Code Coverage metrics meaning
Generating code coverage for parallelized CI runs requires:
generating coverage reports on each parallel container (or shard)
reporting the individual reports to Currents
merging the collected reports, processing and aggregating the results
Code Coverage for Cypress
TL;DR
See a working example GitHub repository
Install
cypress-cloud
version1.9.5+
Install and configure Cypress Code coverage plugin as described here
Run
cypress-cloud
with--experimental-coverage-recording
CLI flag enabled
Enabling code coverage for Cypress involves the following steps:
Instrumenting the code and generating the coverage report (done by
cypress
runner together with Istanbul or any other coverage tool)Uploading the report to Currents for processing (done by
cypress-cloud
package)
Instrumenting the code
Instrumenting the code and generating reports is well described in the detailed guide.
In short:
Install and configure the official @cypress/code-coverage plugin together with the
@cypress/code-coverage/support
support file (the plugin is developed and maintained by the Cypress.io team)Add code instrumentation - for example, by using
@cypress/code-coverage/use-babelrc
for on-the-fly instrumentation
Uploading the reports to Currents
If you haven’t yet, install
cypress-cloud
; make sure to addcypress-cloud/plugin
after@cypress/code-coverage
Optional: provide custom location for generated reports:
cypress-cloud
expects to find the coverage reports at their default location at<projectRoot>/.nyc_output/out.json
You can provide a custom location by setting
env.coverageFile
incypress.config.{jt}s
Example cypress.config.ts
file
Example Cypress support.ts
file
Run cypress-cloud
with coverage enabled
cypress-cloud
with coverage enabledRunning cypress-cloud
with --experimental-coverage-recording
flag will activate the collection of the coverage reports and send them to Currents for processing.
The script will discover the reports at the configured location ./.nyc_output/out.json
by default, or an explicit location defined in env.coverageFile
of cypress.config.{jt}s
Example:
Code Coverage for Playwright
🧪 Code coverage for Playwright is still in progress. Please contact us to share your use case and receive updates.
Browsing Coverage Metrics
Currents will process, aggregate and store the coverage information for each recorded run. In case of parallelized CI runs, Currents will combine the results from all the containers and generate a merged report.
Only coverage reports from fully completed runs are accepted
A run is fully completed if we collect results for all spec files and tests. Cancelled and timed-out runs are not fully completed, thus Currents would ignore the coverage information generated by those runs.
Coverage Metrics
Coverage reports contain metrics for each individual file as well as combined cross-file totals.
Our initial release only displays the total cross-file coverage percentage:
Total cross-file line coverage percentage
Total cross-file branch coverage percentage
Total cross-file function coverage percentage
Total cross-file statement coverage percentage
Please contact us if you need to see additional coverage metrics
Coverage Aggregation Details
In Currents, the hierarchy of data is organized as follows:
Project: The top-level container where all the results are hosted
Run: An instance of executing tests against the code in a project. Multiple runs can belong to a single project.
Group: A subset of a run, grouping specific tests together. Each run can have multiple groups.
When presenting the aggregated coverage report, we follow the next steps:
Get all the runs recorded during the selected period with the current filters (tags, branches) applied
Calculate the average value for the coverage metrics for all groups within a run
Calculate the average value for the aggregated time period (day, week or month)
Last updated